


Steven explains:
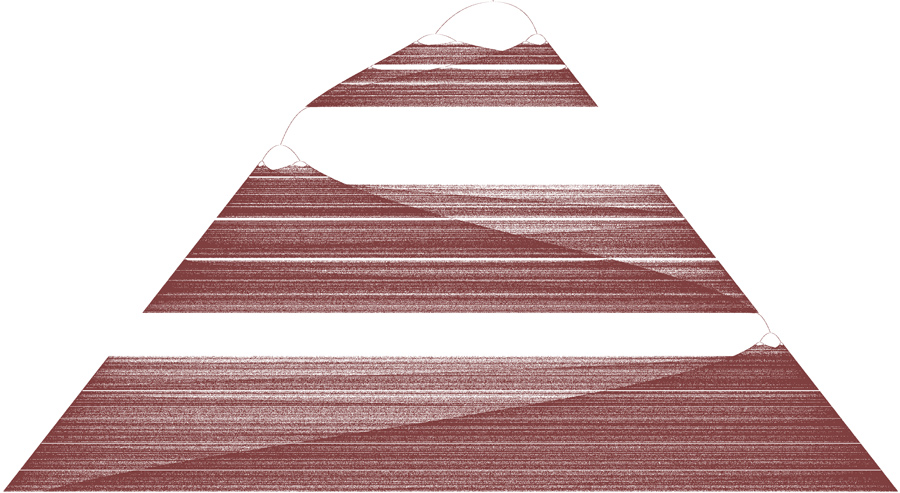
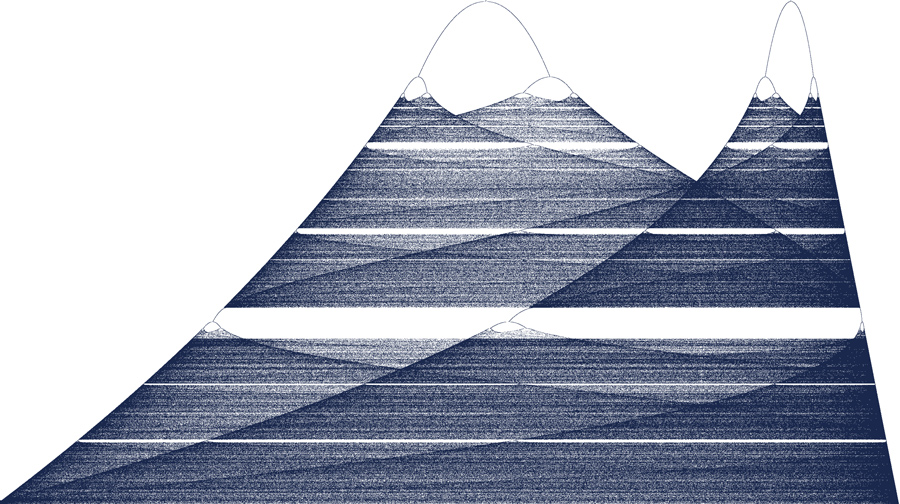
These images are excerpts from the bifurcation diagrams of various one-dimensional maps, including the logistic map [third from top], the hat map [second from bottom], and the cosine map [top image]. Each of these dynamical systems model various physical phenomena in the real world. For example, the logistic map is a crude model of population dynamics with reproduction and limited resources, and it is often used as an example of the period-doubling route to chaos. Typical of chaotic systems, many regions in these figures exhibit self-similarity and reflect the order that emerges out of chaos.
These images were generated numerically by iterating the discrete-time maps above as a bifurcation parameter is varied. The bifurcation parameter is plotted as the y-axis (elevation), and at each elevation, the stratified layer represents the attracting set of the dynamical system for that particular choice of bifurcation parameter. Bifurcation refers to a qualitative change in the behavior or topology of a dynamical system as a parameter is varied.
via Princeton's Art of Science Gallery
50 Watts